
How to Reduce Patient No-Shows: The Ultimate Clinic Strategy Guide
The complete playbook for reducing patient no-shows — calculators, automated reminders, waitlist management, and recall systems. Includes 5 specialty scenarios, ROI models, and downloadable templates.
Why No-Shows Are the Silent Revenue Killer
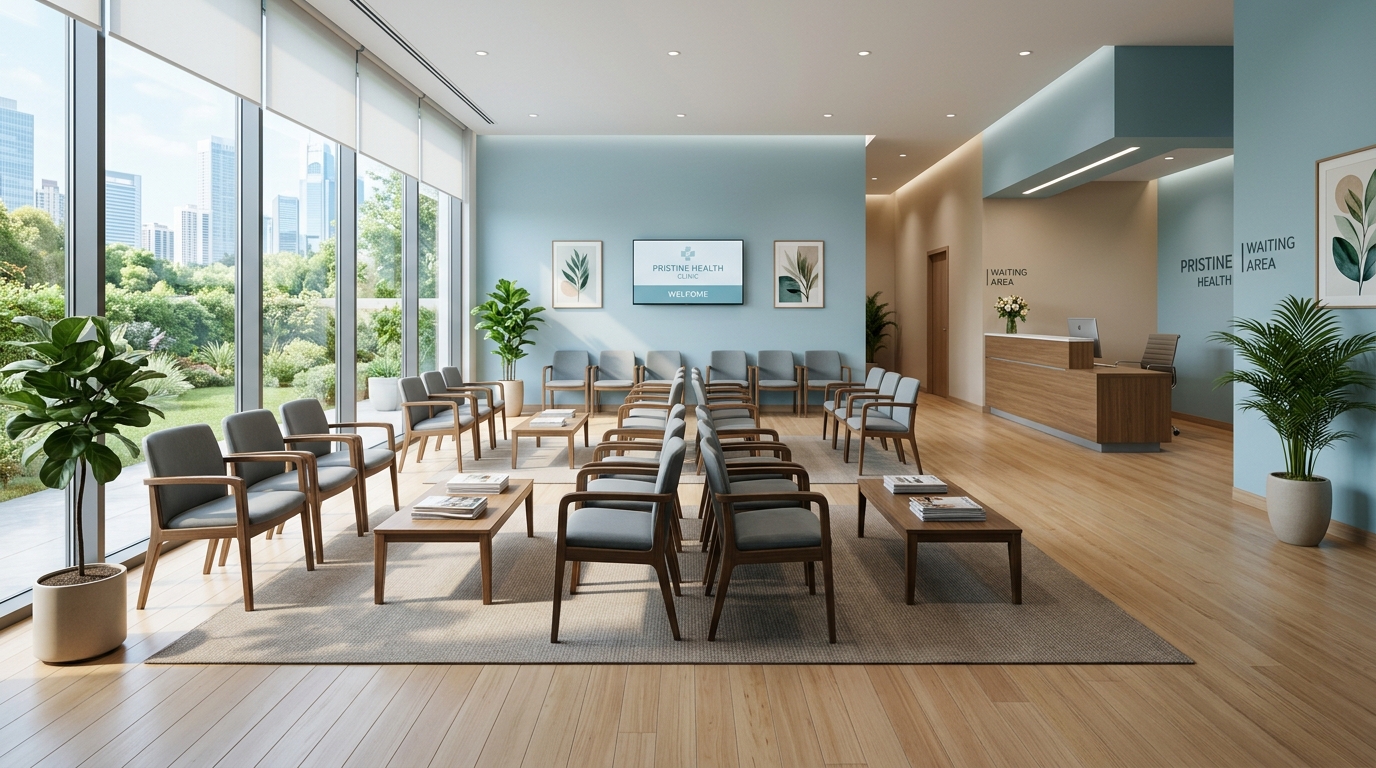
Learning how to reduce patient no-shows starts with understanding that every empty chair is lost clinical capacity. A patient who needed care but didn't show up represents revenue that walked out the door before it ever arrived.
Modern clinics must integrate no-show recovery directly with their overall front desk automation operations to prevent schedule leakage.
The numbers are staggering. The average medical practice loses $150,000–$300,000 annually to no-shows. A 10-provider dental group with a 12% no-show rate watches $400,000+ evaporate every year. A busy med spa with high-value aesthetic procedures can lose $2,500 per single missed appointment.
But the financial hit is only half the story. No-shows cascade:
- Provider time wasted — 15–20 minutes of clinical capacity gone
- Staff morale eroded — Front desk absorbs patient frustration, rescheduling chaos
- Access degraded — Other patients wait longer for appointments
- Care continuity broken — Chronic conditions go unmonitored, preventive care delayed
The practices that solve this don't just "send more reminders." They build a system — layered defenses that catch patients at every friction point, automate the recovery, and turn no-shows from a cost center into a manageable metric.
This guide walks through every layer of modern no-show reduction, from the foundational math that makes the business case to the advanced automation that fills gaps in real time.
The Real Financial Cost of Clinic No-Shows
Before you can justify the investment, you need to see the full picture. Most practices dramatically underestimate their no-show cost because they only count the missed appointment fee — not the downstream impact.
The No-Show Cost Calculator
Calculate your annual leakage using this standard healthcare formula:
Annual No-Show Cost = (Daily Slots × No-Show Rate × Days/Year) × (Avg Visit Revenue + Downstream Revenue per Patient)Benchmarks by Specialty (2024–2025 Data)
| Specialty | Typical No-Show Rate | Avg Visit Revenue | Downstream 12-Mo Value | Annual Cost (10-provider) |
|---|---|---|---|---|
| Dental | 10–15% | $180–$350 | $1,380–$2,200 | $280K–$520K |
| Med Spa / Aesthetics | 15–25% | $400–$1,200 | $4,650–$6,500 | $650K–$1.8M |
| Primary Care | 18–25% | $120–$200 | $850–$1,400 | $320K–$600K |
| Behavioral Health | 20–30% | $150–$250 | $1,800–$4,650 | $400K–$950K |
| Orthopedics / Sports Med | 12–18% | $200–$400 | $2,200–$4,800 | $350K–$800K |
| OB/GYN | 15–22% | $180–$300 | $1,500–$3,200 | $300K–$650K |
| Dermatology | 10–16% | $150–$350 | $1,200–$2,800 | $250K–$500K |
The Hidden Multipliers
| Cost Component | Typical Impact | Notes |
|---|---|---|
| Direct revenue loss | 1× visit value | The visible number |
| Unfilled slot opportunity cost | 0.3–0.5× visit value | Could have been filled from waitlist |
| Staff rescheduling time | $8–$15 per no-show | Front desk + clinical coordination |
| Patient attrition risk | 2–5× visit value | No-show patients 3× more likely to leave practice |
| Provider idle time | 15–20 min per slot | Clinical capacity that can't be recovered |
| Referral leakage | Variable | Patients who no-show often don't return for referred care |
Bottom line: The true cost of a no-show is 3–5× the face-value appointment revenue. A $200 primary care visit actually costs $600–$1,000 when fully accounted.

Why Patients Miss Appointments & How to Reduce Patient No-Shows
If you don't know why they're not showing up, you can't fix it. The research is surprisingly consistent across specialties and demographics.
Top 7 Root Causes (Ranked by Frequency)
| Rank | Cause | % of No-Shows | Fix Priority |
|---|---|---|---|
| 1 | Forgot / scheduling conflict | 35–45% | Automated reminders (multi-channel) |
| 2 | Transportation / logistics | 15–20% | Telehealth option, ride partnerships |
| 3 | Cost anxiety / insurance confusion | 12–18% | Pre-visit cost estimates, financial counseling |
| 4 | Fear / anxiety about procedure | 8–12% | Pre-visit education, sedation options |
| 5 | Feeling better / symptom resolution | 8–10% | Value reinforcement in reminders |
| 6 | Poor communication / unclear instructions | 5–8% | Clear prep instructions, portal access |
| 7 | Dissatisfaction with prior visit | 3–5% | Experience feedback loops, recovery protocols |
The "No-Show Profile" Your Data Already Has
Run this query in your EHR/PM to find the 20% of patients generating 80% of your no-shows:
Automated Appointment Reminders: SMS vs. Voice vs. Email
Reminders are your first line of defense. But not all channels are created equal, and the "spray and pray" approach burns opt-outs.
Channel Effectiveness (2024–2025 Benchmarks)
| Channel | Open/Answer Rate | Confirmation Rate | Best For |
|---|---|---|---|
| SMS | 98% | 45–55% | Primary channel, all demographics |
| Automated Voice | 65–75% | 35–45% | Elderly, landline-heavy populations |
| 25–35% | 15–25% | Detail-rich prep instructions, attachments | |
| Patient Portal Push | 40–50% | 30–40% | Engaged patients, chronic care |
The Winning Multi-Channel Sequence
Message Templates by Channel
Compliance Checklist (TCPA + HIPAA)
- Express consent captured at booking (TCPA)
- STOP/HELP honored instantly (automated)
- No PHI in SMS/voice — appointment type only, link to portal for details
- Frequency cap — max 4 messages per appointment cycle
- Quiet hours — no messages 9 PM–8 AM (local time)
- BAA with messaging vendor — Twilio, SignalWire, Bandwidth healthcare tiers
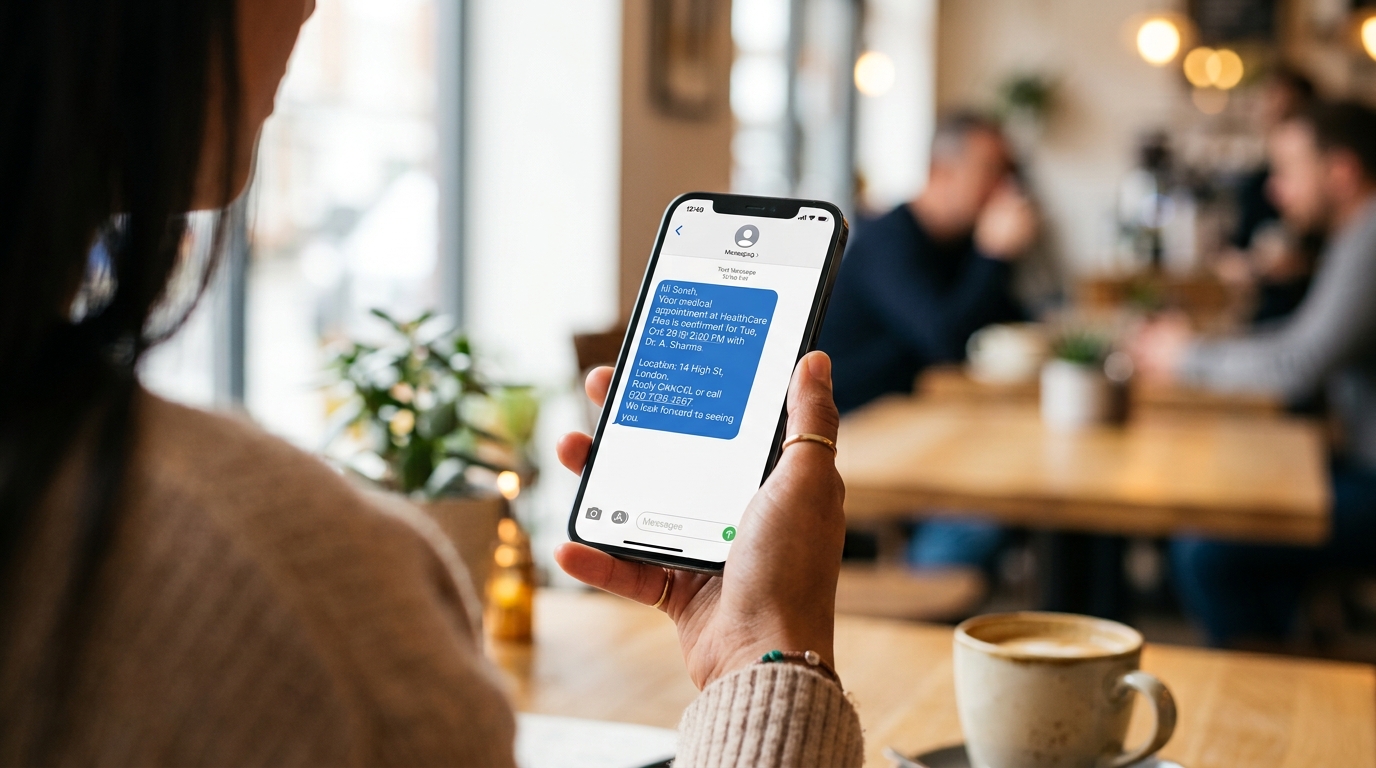
Should Your Clinic Charge a No-Show Fee?
The fee debate is emotional. The data is not. Here is what happens when practices implement a structured fee policy:
| Metric | Practices WITH Fee | Practices WITHOUT Fee |
|---|---|---|
| No-show rate | 8–12% | 15–25% |
| Patient complaints | +15–20% | Baseline |
| Net revenue impact | +$120K–$280K/yr | Baseline |
Implementation Without the Backlash
- Communicate 60 days ahead — Email, portal banner, front desk signage.
- Make it patient-friendly — Frame as "We reserve this time exclusively for you."
- Automate the waiver — e.g., 24-hr notice = auto-waive (removes front desk judgment calls).
- Offer alternatives — Always include a Telehealth or reschedule link in every reminder.
No-Show Follow-Up Templates That Win Back Patients
The no-show happened. Now what? Most practices do nothing — or send a generic "we missed you" letter weeks later. The recovery window is 24–48 hours.
High-Converting Templates by Scenario
| Scenario | Channel | Template | Conversion |
|---|---|---|---|
| Standard no-show | SMS | "Hi [Name], missed you today at [Time]. Dr. [Name] has 2 spots tomorrow at [Times]. Book: [link] or reply Y." | 35–42% |
| High-value procedure | Voice + SMS | Personal call from coordinator + SMS link | 50–60% |
| Chronic care patient | SMS + Portal | "Your [condition] check-in was today. Reschedule: [link]. Need a telehealth option instead?" | 45–55% |
| New patient | SMS + Email | "Welcome to [Clinic]! Sorry we missed you. Let's get you in: [link]. Questions? Reply here." | 30–38% |
Automated Rescheduling Sequences That Improve Retention
Rescheduling isn't recovery — it's retention. The goal: zero-friction rebooking that keeps the patient in your care continuum.
Smart Rescheduling Rules
| Rule | Logic | Why |
|---|---|---|
| Provider continuity | Default to same provider | Retention + clinical continuity |
| Visit type matching | Same duration, same room type | Operational efficiency |
| Waitlist priority | If patient was waitlisted, offer that slot first | Fairness + fill rate |
| No double-booking | Hard stop in EHR | Prevents front desk chaos |
Filling Last-Minute Cancellations with AI Waitlist Management
A cancellation is a gift — if you can fill it fast. The average manual practice fills 15–25% of cancelled slots. With an AI waitlist, 50–70% is consistently achievable.
Deploying automated call workflows and checking our comprehensive AI medical receptionist guide reveals how clinics fill open slots instantly.
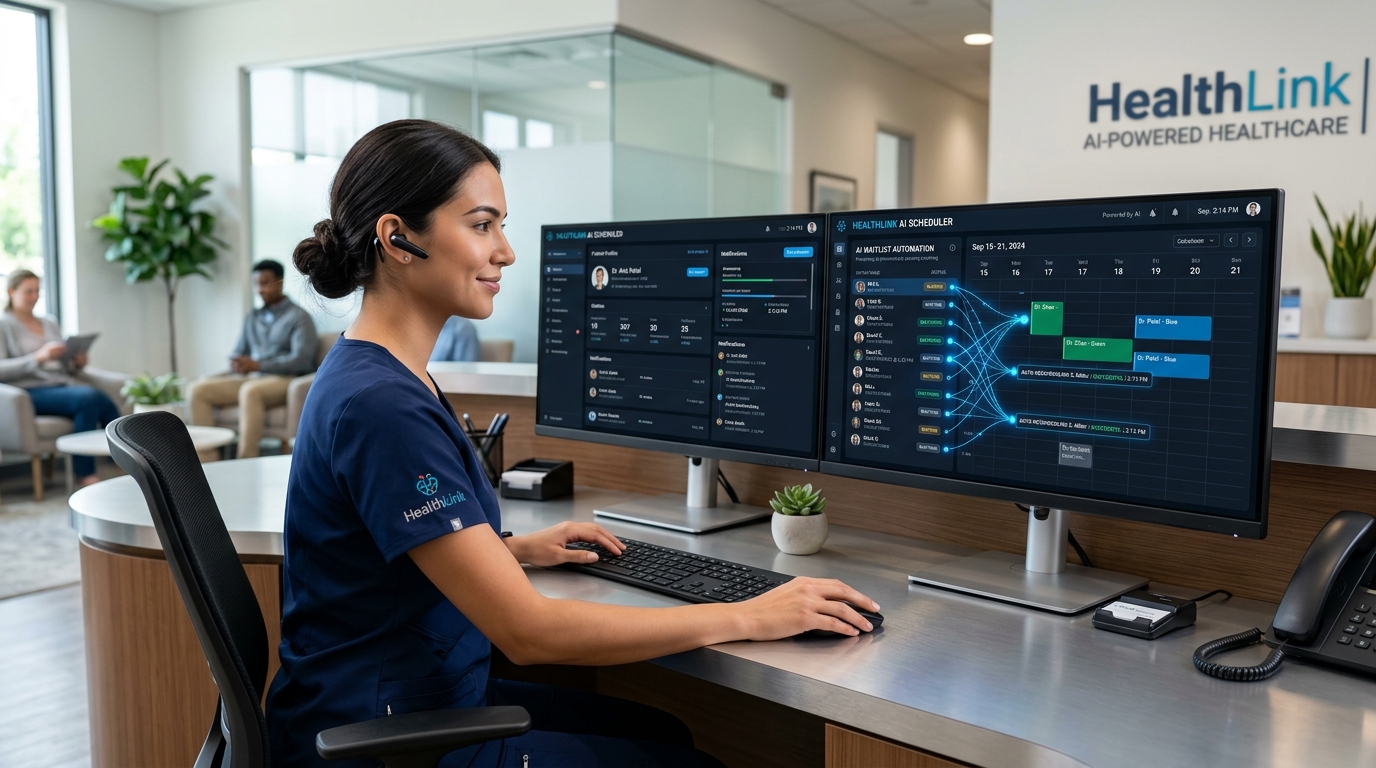
Building a Patient Recall System That Runs on Autopilot
Recall is the long game. No-show reduction fixes today's holes; recall prevents tomorrow's. A mature recall system generates 20–35% of total appointments automatically.
Recall Performance by Specialty
| Specialty | Recall-Driven Appts | Automation Rate | Revenue/Recall Appt |
|---|---|---|---|
| Dental | 35–45% | 80–90% | $180–$350 (hygiene) |
| Primary Care | 25–35% | 70–80% | $150–$250 (wellness) |
| Med Spa | 20–30% | 60–70% | $400–$1,200 (maintenance) |
| Behavioral Health | 30–40% | 75–85% | $150–$250 (therapy) |
Implementation Roadmap: 30-60-90 Day No-Show Reduction Plan
Days 1–30: Foundation & Quick Wins
- Week 1: Pull 12-month no-show data, calculate true cost, and segment chronic offenders.
- Week 2: Upgrade to multi-channel reminders (SMS + Email + Voice) and deploy 4-touch sequence.
- Week 3: Deploy T+30min to T+72hr recovery messages; train front desk on repeat offender outreach.
- Week 4: Compare 4-week rate vs. baseline and document waitlist fill rate.
Days 31–90: Automation, Scale & Culture
| Phase | Focus | Key Actions |
|---|---|---|
| Weeks 5–7 | Smart Recall & Waitlist | Configure clinical recall rules per specialty, deploy smart AI waitlist matching. |
| Weeks 8–10 | Rescheduling & Policy | Enable self-scheduling links, issue 60-day notice for no-show fees (if chosen), setup real-time dashboards. |
| Weeks 11–14 | Feedback & Training | Post-visit survey for no-show reasons, refresh staff training on recovery call role-playing. |
Frequently Asked Questions
How much does no-show reduction automation cost?
$200–$1,500/month depending on volume and sophistication. Basic multi-channel reminders run $200–$500. Advanced AI waitlist + smart recall suites average $500–$1,500. The ROI is typically 5–15× within the first 90 days.
Will patients get annoyed by too many messages?
Not if channeled right. Data shows patients prefer SMS for reminders, voice for unconfirmed, email for details. The key is strict frequency caps (max 4 per appointment), respecting quiet hours, and honoring instant STOP requests. Opt-out rates stay <2% with proper workflow design.
Can we do this without an EHR integration?
Yes, but it's manual. You can export schedules, upload to a messaging platform, and manually mark no-shows. But bi-directional, real-time integration is what makes waitlist fill rates jump from 25% to 60%+. Budget for integration in Phase 2.
What about patients without smartphones?
Voice calls + landline SMS (Twilio/SignalWire support landline texting). For elderly populations, default to voice-first sequence. Family/caregiver contact capture at intake is essential.
How do we handle same-day cancellations vs. no-shows?
Different workflows. Cancellation = slot known available immediately → waitlist fires. No-show = slot confirmed empty at appointment time → recovery sequence fires. Both feed the same waitlist.
What's the single highest-impact change?
Multi-channel reminders with self-scheduling links. This alone typically drops no-shows 20–30% in the first 30 days. Everything else compounds on that foundation.
How do we get provider buy-in?
Show them their numbers. "Dr. Smith, you had 47 no-shows last quarter = $38,000 in lost revenue and 12 hours of idle clinical time. Here's the plan to fix it." Providers respond to their own data, not administrative mandates.
Can AI really fill waitlist slots better than my front desk?
Yes — purely due to speed and scale. Your front desk calls 1–2 patients, waits for callbacks, and moves to the next. AI messages 10–20 simultaneously, accepts the first response, and auto-books. The massive difference in fill rates (15% vs 60%) is almost entirely based on speed to contact.
Ready to stop the revenue bleed?
Book a 30-minute no-show audit — we'll calculate your exact cost, map the automation opportunity, and give you a customized 90-day reduction plan.
📅 Schedule Your No-Show Audit →